2. EDA
![]()
In the previous chapter, we examined the structure of deep learning models and evaluation metrics for time series analysis. In this chapter, we will explore and visualize the datasets we will be using to perform time series forecasting in the next chapter.
We will use COVID-19 daily case datasets for the time series forecasting. The datasets we are going to use are COVID-19 Data Repository by the Center for Systems Science and Engineering (CSSE) at Johns Hopkins University and Kaggle: Novel Corona Virus 2019 Dataset.
COVID-19 daily cases by country are updated in the repository of Johns Hopkins University every day, along with various types of datasets, which are provided by Johns Hopkins University on its website and Kaggle.
In chapter 2.1, we will download the COVID-19 daily case datasets to see what features are included in them. In 2.2, we will perform EDA (Exploratory Data Analysis) on the datasets, focusing on world countries, and then in 2.3, we will dive into the COVID-19 daily cases in South Korea.
2.1 Download Datasets
Firstly, we will download the COVID-19 daily case datasets. Using the data-loader function coded by Pseudo-Lab, we can easily download the datasets.
Download the datasets from the repository of Tutorial-Book-Utils on GitHub by using git clone to save them in the Colab enviroment.
!git clone https://github.com/Pseudo-Lab/Tutorial-Book-Utils
Cloning into 'Tutorial-Book-Utils'...
remote: Enumerating objects: 24, done.
remote: Counting objects: 100% (24/24), done.
remote: Compressing objects: 100% (20/20), done.
remote: Total 24 (delta 6), reused 14 (delta 3), pack-reused 0
Unpacking objects: 100% (24/24), done.

Figure 2-1. Downloaded Files in Colab
In Figure 2-1, you can see PL_data_loader.py in the directory, in addition to README.md and utils_ObjectDetection.py. PL_data_loader.py contains the functions to download Google Drive datasets. It is possible to download the COVID-19 daily case datasets with the input of COVIDTimeSeries if we use the parameter –data.
!python Tutorial-Book-Utils/PL_data_loader.py --data COVIDTimeSeries
COVIDTimeSeries.zip is done!
Next, let’s unarchive the downloaded file by using unzip, which is a Linux command. Unnecessary outputs are not printed if we use the command -q.
!unzip -q COVIDTimeSeries.zip

Figure 2-2. Downloaded Datasets
Once the COVIDTimesSeries.zip is unarchived, you can see two downloaded files: covid_19_data.csv and time_series_covid19_confirmed_global.csv (Figure 2-2).
We will visualize the global COVID-19 daily cases with covid_19_data.csv based on time series, and we will visualize the daily cases of COVID-19 in South Korea with time_series_covid19_confirmed_global.csv. Let’s first view the saved values after loading each dataset.
import pandas as pd

all = pd.read_csv('covid_19_data.csv')
confirmed = pd.read_csv('time_series_covid19_confirmed_global.csv')
all contains daily confirmed cases, daily deaths, and daily recovered data. The dataframe of the dataset consists of ObservationDate, Province/State, Country/Region, Confirmed, Deaths, and Recovered.
all
| SNo | ObservationDate | Province/State | Country/Region | Last Update | Confirmed | Deaths | Recovered | |
|---|---|---|---|---|---|---|---|---|
| 0 | 1 | 01/22/2020 | Anhui | Mainland China | 1/22/2020 17:00 | 1.0 | 0.0 | 0.0 |
| 1 | 2 | 01/22/2020 | Beijing | Mainland China | 1/22/2020 17:00 | 14.0 | 0.0 | 0.0 |
| 2 | 3 | 01/22/2020 | Chongqing | Mainland China | 1/22/2020 17:00 | 6.0 | 0.0 | 0.0 |
| 3 | 4 | 01/22/2020 | Fujian | Mainland China | 1/22/2020 17:00 | 1.0 | 0.0 | 0.0 |
| 4 | 5 | 01/22/2020 | Gansu | Mainland China | 1/22/2020 17:00 | 0.0 | 0.0 | 0.0 |
| ... | ... | ... | ... | ... | ... | ... | ... | ... |
| 172475 | 172476 | 12/06/2020 | Zaporizhia Oblast | Ukraine | 2020-12-07 05:26:14 | 36539.0 | 337.0 | 6556.0 |
| 172476 | 172477 | 12/06/2020 | Zeeland | Netherlands | 2020-12-07 05:26:14 | 6710.0 | 104.0 | 0.0 |
| 172477 | 172478 | 12/06/2020 | Zhejiang | Mainland China | 2020-12-07 05:26:14 | 1295.0 | 1.0 | 1288.0 |
| 172478 | 172479 | 12/06/2020 | Zhytomyr Oblast | Ukraine | 2020-12-07 05:26:14 | 31967.0 | 531.0 | 22263.0 |
| 172479 | 172480 | 12/06/2020 | Zuid-Holland | Netherlands | 2020-12-07 05:26:14 | 154813.0 | 2414.0 | 0.0 |
172480 rows × 8 columns
confirmed is sequential data showing daily cases by country. Country/Region and Province/State are location data. Long and Lat are longitude and latitude, respectively. MM/DD/YYYY column records daily confirmed cases. The dataframe looks like below.
confirmed
| Province/State | Country/Region | Lat | Long | 1/22/20 | 1/23/20 | 1/24/20 | 1/25/20 | 1/26/20 | 1/27/20 | 1/28/20 | 1/29/20 | 1/30/20 | 1/31/20 | 2/1/20 | 2/2/20 | 2/3/20 | 2/4/20 | 2/5/20 | 2/6/20 | 2/7/20 | 2/8/20 | 2/9/20 | 2/10/20 | 2/11/20 | 2/12/20 | 2/13/20 | 2/14/20 | 2/15/20 | 2/16/20 | 2/17/20 | 2/18/20 | 2/19/20 | 2/20/20 | 2/21/20 | 2/22/20 | 2/23/20 | 2/24/20 | 2/25/20 | 2/26/20 | ... | 11/9/20 | 11/10/20 | 11/11/20 | 11/12/20 | 11/13/20 | 11/14/20 | 11/15/20 | 11/16/20 | 11/17/20 | 11/18/20 | 11/19/20 | 11/20/20 | 11/21/20 | 11/22/20 | 11/23/20 | 11/24/20 | 11/25/20 | 11/26/20 | 11/27/20 | 11/28/20 | 11/29/20 | 11/30/20 | 12/1/20 | 12/2/20 | 12/3/20 | 12/4/20 | 12/5/20 | 12/6/20 | 12/7/20 | 12/8/20 | 12/9/20 | 12/10/20 | 12/11/20 | 12/12/20 | 12/13/20 | 12/14/20 | 12/15/20 | 12/16/20 | 12/17/20 | 12/18/20 | |
|---|---|---|---|---|---|---|---|---|---|---|---|---|---|---|---|---|---|---|---|---|---|---|---|---|---|---|---|---|---|---|---|---|---|---|---|---|---|---|---|---|---|---|---|---|---|---|---|---|---|---|---|---|---|---|---|---|---|---|---|---|---|---|---|---|---|---|---|---|---|---|---|---|---|---|---|---|---|---|---|---|---|
| 0 | NaN | Afghanistan | 33.939110 | 67.709953 | 0 | 0 | 0 | 0 | 0 | 0 | 0 | 0 | 0 | 0 | 0 | 0 | 0 | 0 | 0 | 0 | 0 | 0 | 0 | 0 | 0 | 0 | 0 | 0 | 0 | 0 | 0 | 0 | 0 | 0 | 0 | 0 | 0 | 1 | 1 | 1 | ... | 42297 | 42463 | 42609 | 42795 | 42969 | 43035 | 43240 | 43468 | 43681 | 43924 | 44177 | 44363 | 44503 | 44706 | 44988 | 45174 | 45384 | 45600 | 45723 | 45844 | 46116 | 46274 | 46516 | 46718 | 46837 | 46837 | 47072 | 47306 | 47516 | 47716 | 47851 | 48053 | 48116 | 48229 | 48527 | 48718 | 48952 | 49161 | 49378 | 49621 |
| 1 | NaN | Albania | 41.153300 | 20.168300 | 0 | 0 | 0 | 0 | 0 | 0 | 0 | 0 | 0 | 0 | 0 | 0 | 0 | 0 | 0 | 0 | 0 | 0 | 0 | 0 | 0 | 0 | 0 | 0 | 0 | 0 | 0 | 0 | 0 | 0 | 0 | 0 | 0 | 0 | 0 | 0 | ... | 24731 | 25294 | 25801 | 26211 | 26701 | 27233 | 27830 | 28432 | 29126 | 29837 | 30623 | 31459 | 32196 | 32761 | 33556 | 34300 | 34944 | 35600 | 36245 | 36790 | 37625 | 38182 | 39014 | 39719 | 40501 | 41302 | 42148 | 42988 | 43683 | 44436 | 45188 | 46061 | 46863 | 47742 | 48530 | 49191 | 50000 | 50637 | 51424 | 52004 |
| 2 | NaN | Algeria | 28.033900 | 1.659600 | 0 | 0 | 0 | 0 | 0 | 0 | 0 | 0 | 0 | 0 | 0 | 0 | 0 | 0 | 0 | 0 | 0 | 0 | 0 | 0 | 0 | 0 | 0 | 0 | 0 | 0 | 0 | 0 | 0 | 0 | 0 | 0 | 0 | 0 | 1 | 1 | ... | 62693 | 63446 | 64257 | 65108 | 65975 | 66819 | 67679 | 68589 | 69591 | 70629 | 71652 | 72755 | 73774 | 74862 | 75867 | 77000 | 78025 | 79110 | 80168 | 81212 | 82221 | 83199 | 84152 | 85084 | 85927 | 86730 | 87502 | 88252 | 88825 | 89416 | 90014 | 90579 | 91121 | 91638 | 92102 | 92597 | 93065 | 93507 | 93933 | 94371 |
| 3 | NaN | Andorra | 42.506300 | 1.521800 | 0 | 0 | 0 | 0 | 0 | 0 | 0 | 0 | 0 | 0 | 0 | 0 | 0 | 0 | 0 | 0 | 0 | 0 | 0 | 0 | 0 | 0 | 0 | 0 | 0 | 0 | 0 | 0 | 0 | 0 | 0 | 0 | 0 | 0 | 0 | 0 | ... | 5437 | 5477 | 5567 | 5616 | 5725 | 5725 | 5872 | 5914 | 5951 | 6018 | 6066 | 6142 | 6207 | 6256 | 6304 | 6351 | 6428 | 6534 | 6610 | 6610 | 6712 | 6745 | 6790 | 6842 | 6904 | 6955 | 7005 | 7050 | 7084 | 7127 | 7162 | 7190 | 7236 | 7288 | 7338 | 7382 | 7382 | 7446 | 7466 | 7519 |
| 4 | NaN | Angola | -11.202700 | 17.873900 | 0 | 0 | 0 | 0 | 0 | 0 | 0 | 0 | 0 | 0 | 0 | 0 | 0 | 0 | 0 | 0 | 0 | 0 | 0 | 0 | 0 | 0 | 0 | 0 | 0 | 0 | 0 | 0 | 0 | 0 | 0 | 0 | 0 | 0 | 0 | 0 | ... | 12680 | 12816 | 12953 | 13053 | 13228 | 13374 | 13451 | 13615 | 13818 | 13922 | 14134 | 14267 | 14413 | 14493 | 14634 | 14742 | 14821 | 14920 | 15008 | 15087 | 15103 | 15139 | 15251 | 15319 | 15361 | 15493 | 15536 | 15591 | 15648 | 15729 | 15804 | 15925 | 16061 | 16161 | 16188 | 16277 | 16362 | 16407 | 16484 | 16562 |
| ... | ... | ... | ... | ... | ... | ... | ... | ... | ... | ... | ... | ... | ... | ... | ... | ... | ... | ... | ... | ... | ... | ... | ... | ... | ... | ... | ... | ... | ... | ... | ... | ... | ... | ... | ... | ... | ... | ... | ... | ... | ... | ... | ... | ... | ... | ... | ... | ... | ... | ... | ... | ... | ... | ... | ... | ... | ... | ... | ... | ... | ... | ... | ... | ... | ... | ... | ... | ... | ... | ... | ... | ... | ... | ... | ... | ... | ... | ... | ... | ... | ... |
| 266 | NaN | Vietnam | 14.058324 | 108.277199 | 0 | 2 | 2 | 2 | 2 | 2 | 2 | 2 | 2 | 2 | 6 | 6 | 8 | 8 | 8 | 10 | 10 | 13 | 13 | 14 | 15 | 15 | 16 | 16 | 16 | 16 | 16 | 16 | 16 | 16 | 16 | 16 | 16 | 16 | 16 | 16 | ... | 1215 | 1226 | 1252 | 1253 | 1256 | 1265 | 1281 | 1283 | 1288 | 1300 | 1304 | 1305 | 1306 | 1307 | 1312 | 1316 | 1321 | 1331 | 1339 | 1341 | 1343 | 1347 | 1351 | 1358 | 1361 | 1361 | 1365 | 1366 | 1367 | 1377 | 1381 | 1385 | 1391 | 1395 | 1397 | 1402 | 1405 | 1405 | 1407 | 1410 |
| 267 | NaN | West Bank and Gaza | 31.952200 | 35.233200 | 0 | 0 | 0 | 0 | 0 | 0 | 0 | 0 | 0 | 0 | 0 | 0 | 0 | 0 | 0 | 0 | 0 | 0 | 0 | 0 | 0 | 0 | 0 | 0 | 0 | 0 | 0 | 0 | 0 | 0 | 0 | 0 | 0 | 0 | 0 | 0 | ... | 58838 | 59422 | 60065 | 60784 | 61514 | 62167 | 63031 | 63867 | 64935 | 66186 | 67296 | 68768 | 70254 | 71644 | 73196 | 75007 | 76727 | 78493 | 80429 | 81890 | 83585 | 85647 | 88004 | 90192 | 92708 | 94676 | 96098 | 98038 | 99758 | 101109 | 102992 | 104879 | 106622 | 108099 | 109738 | 111102 | 113409 | 115606 | 117755 | 119612 |
| 268 | NaN | Yemen | 15.552727 | 48.516388 | 0 | 0 | 0 | 0 | 0 | 0 | 0 | 0 | 0 | 0 | 0 | 0 | 0 | 0 | 0 | 0 | 0 | 0 | 0 | 0 | 0 | 0 | 0 | 0 | 0 | 0 | 0 | 0 | 0 | 0 | 0 | 0 | 0 | 0 | 0 | 0 | ... | 2071 | 2071 | 2071 | 2071 | 2072 | 2072 | 2072 | 2078 | 2081 | 2083 | 2086 | 2090 | 2093 | 2099 | 2107 | 2114 | 2124 | 2137 | 2148 | 2160 | 2177 | 2191 | 2197 | 2217 | 2239 | 2267 | 2304 | 2337 | 2383 | 2078 | 2079 | 2081 | 2082 | 2083 | 2083 | 2084 | 2085 | 2085 | 2087 | 2087 |
| 269 | NaN | Zambia | -13.133897 | 27.849332 | 0 | 0 | 0 | 0 | 0 | 0 | 0 | 0 | 0 | 0 | 0 | 0 | 0 | 0 | 0 | 0 | 0 | 0 | 0 | 0 | 0 | 0 | 0 | 0 | 0 | 0 | 0 | 0 | 0 | 0 | 0 | 0 | 0 | 0 | 0 | 0 | ... | 16971 | 16997 | 17036 | 17056 | 17093 | 17097 | 17123 | 17187 | 17243 | 17280 | 17350 | 17373 | 17394 | 17424 | 17454 | 17466 | 17535 | 17553 | 17569 | 17589 | 17608 | 17647 | 17665 | 17700 | 17730 | 17857 | 17898 | 17916 | 17931 | 17963 | 18062 | 18091 | 18161 | 18217 | 18274 | 18322 | 18428 | 18456 | 18504 | 18575 |
| 270 | NaN | Zimbabwe | -19.015438 | 29.154857 | 0 | 0 | 0 | 0 | 0 | 0 | 0 | 0 | 0 | 0 | 0 | 0 | 0 | 0 | 0 | 0 | 0 | 0 | 0 | 0 | 0 | 0 | 0 | 0 | 0 | 0 | 0 | 0 | 0 | 0 | 0 | 0 | 0 | 0 | 0 | 0 | ... | 8561 | 8610 | 8667 | 8696 | 8765 | 8786 | 8829 | 8897 | 8945 | 8981 | 9046 | 9120 | 9172 | 9220 | 9308 | 9398 | 9508 | 9623 | 9714 | 9822 | 9822 | 9950 | 10129 | 10129 | 10424 | 10547 | 10617 | 10718 | 10839 | 10912 | 11007 | 11081 | 11162 | 11219 | 11246 | 11358 | 11522 | 11749 | 11866 | 12047 |
271 rows × 336 columns
2.2 EDA of World Data
Let’s visualize the global COVID-19 daily cases using all. As mentioned above, there are two location data: Province/State and Country/Region. We will add the daily cases of every country based on Country/Region.
group = all.groupby(['ObservationDate', 'Country/Region'])['Confirmed'].sum()
group = group.reset_index()
group.head()
| ObservationDate | Country/Region | Confirmed | |
|---|---|---|---|
| 0 | 01/22/2020 | Hong Kong | 0.0 |
| 1 | 01/22/2020 | Japan | 2.0 |
| 2 | 01/22/2020 | Macau | 1.0 |
| 3 | 01/22/2020 | Mainland China | 547.0 |
| 4 | 01/22/2020 | South Korea | 1.0 |
You can now see daily confirmed cases by country. Next, we will visualize world daily cases on the world map with animation effects. We can create the visualization with the plotly.express package.
import plotly as py
import plotly.express as px
With px.choropleth, we create the map layer, and then update dates through .update_layout.
Each parameter is as follows:
location : name of the column which indicates location information in the dataframe
locationmode : the range of countries (‘ISO-3’, ‘USA-states’, and ‘country names’)
color : name of the column which has data to be expressed on the diagram
animation_frame : name of the column for animation effects
Press the play button to see the COVID-19 daily case graphs.
choro_map=px.choropleth(group,
                    locations="Country/Region",
                    locationmode = "country names",
                    color="Confirmed",
                    animation_frame="ObservationDate"
                   )

choro_map.update_layout(
    title_text = 'Global Spread of Coronavirus',
    title_x = 0.5,
    geo=dict(
        showframe = False,
        showcoastlines = False,
    ))

choro_map.show()
You can see that COVID-19 begins in China and then gradually spreads throughout the world. According to the visualization, recently there are a lot of cumulative cases in North America, South America, and India, compared to other countries.
2.3 EDA of South Korean Dataset
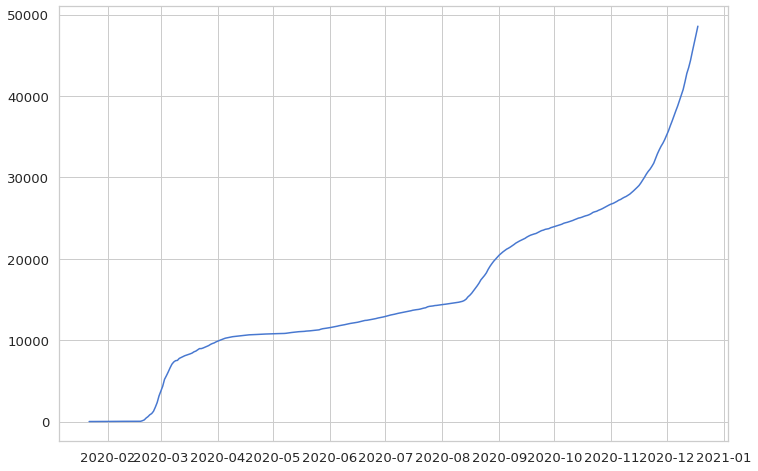
This time, we will extract the South Korean data from confirmed. The data is cumulative, which means it shows the sum of all cases on a given date.
confirmed[confirmed['Country/Region']=='Korea, South']
| Province/State | Country/Region | Lat | Long | 1/22/20 | 1/23/20 | 1/24/20 | 1/25/20 | 1/26/20 | 1/27/20 | 1/28/20 | 1/29/20 | 1/30/20 | 1/31/20 | 2/1/20 | 2/2/20 | 2/3/20 | 2/4/20 | 2/5/20 | 2/6/20 | 2/7/20 | 2/8/20 | 2/9/20 | 2/10/20 | 2/11/20 | 2/12/20 | 2/13/20 | 2/14/20 | 2/15/20 | 2/16/20 | 2/17/20 | 2/18/20 | 2/19/20 | 2/20/20 | 2/21/20 | 2/22/20 | 2/23/20 | 2/24/20 | 2/25/20 | 2/26/20 | ... | 11/9/20 | 11/10/20 | 11/11/20 | 11/12/20 | 11/13/20 | 11/14/20 | 11/15/20 | 11/16/20 | 11/17/20 | 11/18/20 | 11/19/20 | 11/20/20 | 11/21/20 | 11/22/20 | 11/23/20 | 11/24/20 | 11/25/20 | 11/26/20 | 11/27/20 | 11/28/20 | 11/29/20 | 11/30/20 | 12/1/20 | 12/2/20 | 12/3/20 | 12/4/20 | 12/5/20 | 12/6/20 | 12/7/20 | 12/8/20 | 12/9/20 | 12/10/20 | 12/11/20 | 12/12/20 | 12/13/20 | 12/14/20 | 12/15/20 | 12/16/20 | 12/17/20 | 12/18/20 | |
|---|---|---|---|---|---|---|---|---|---|---|---|---|---|---|---|---|---|---|---|---|---|---|---|---|---|---|---|---|---|---|---|---|---|---|---|---|---|---|---|---|---|---|---|---|---|---|---|---|---|---|---|---|---|---|---|---|---|---|---|---|---|---|---|---|---|---|---|---|---|---|---|---|---|---|---|---|---|---|---|---|---|
| 157 | NaN | Korea, South | 35.907757 | 127.766922 | 1 | 1 | 2 | 2 | 3 | 4 | 4 | 4 | 4 | 11 | 12 | 15 | 15 | 16 | 19 | 23 | 24 | 24 | 25 | 27 | 28 | 28 | 28 | 28 | 28 | 29 | 30 | 31 | 31 | 104 | 204 | 433 | 602 | 833 | 977 | 1261 | ... | 27653 | 27799 | 27942 | 28133 | 28338 | 28546 | 28769 | 28998 | 29311 | 29654 | 30017 | 30403 | 30733 | 31004 | 31353 | 31735 | 32318 | 32887 | 33375 | 33824 | 34201 | 34652 | 35163 | 35703 | 36332 | 36915 | 37546 | 38161 | 38755 | 39432 | 40098 | 40786 | 41736 | 42766 | 43484 | 44364 | 45442 | 46453 | 47515 | 48570 |
1 rows × 336 columns
Excluding the Lat and Long columns, we only have the date and cases columns. For coding convenience, let’s flip the rows and columns and change the date format from str to datetime (to_datetime).
korea = confirmed[confirmed['Country/Region']=='Korea, South'].iloc[:,4:].T
korea.index = pd.to_datetime(korea.index)
korea
| 157 | |
|---|---|
| 2020-01-22 | 1 |
| 2020-01-23 | 1 |
| 2020-01-24 | 2 |
| 2020-01-25 | 2 |
| 2020-01-26 | 3 |
| ... | ... |
| 2020-12-14 | 44364 |
| 2020-12-15 | 45442 |
| 2020-12-16 | 46453 |
| 2020-12-17 | 47515 |
| 2020-12-18 | 48570 |
332 rows × 1 columns
Let’s visualize the data with matplotlib.pyplot and seaborn, which are representative visualization packages. With %matplotlib inline, the matplotlib graphs will be included in the notebook, along with the code. You can change the figure size through rcParams['figure.figsize'] from pylab and the style and font size through sns.set.
import matplotlib.pyplot as plt
import seaborn as sns
%matplotlib inline
from pylab import rcParams
rcParams['figure.figsize'] = 12, 8
sns.set(style='whitegrid', palette='muted', font_scale=1.2)

plt.plot(korea)
plt.show()
Now, let’s look at daily cases instead of cumulative cases. Using the diff function, it is possible to tell the difference between each row, which makes it easier to transform cumulative data into daily data. However, there is a missing value in the first row of the cumulative data, which we need to fill. Also, we will change the data format to an integer (int).
daily_cases = korea.diff().fillna(korea.iloc[0]).astype('int')
daily_cases
| 157 | |
|---|---|
| 2020-01-22 | 1 |
| 2020-01-23 | 0 |
| 2020-01-24 | 1 |
| 2020-01-25 | 0 |
| 2020-01-26 | 1 |
| ... | ... |
| 2020-12-14 | 880 |
| 2020-12-15 | 1078 |
| 2020-12-16 | 1011 |
| 2020-12-17 | 1062 |
| 2020-12-18 | 1055 |
332 rows × 1 columns
The following visualization is the output for daily cases. Since we already created a visualization, the visualization parameters will be based on the previous data unless you reset the parameters.
plt.plot(daily_cases)
plt.show()
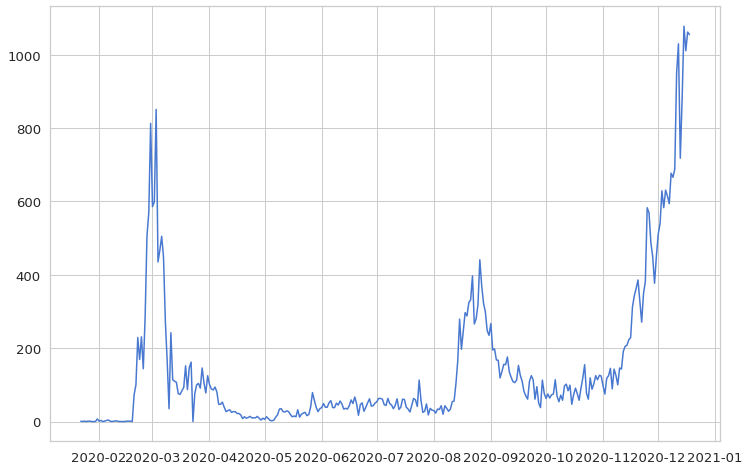
There are spikes in the beginning of March and late August. At the end of the year, new daily cases skyrocket.
In this chapter, we explored COVID-19 confirmed case datasets in South Korea and across the world. In the next chapter, we will learn about data pre-processing of COVID-19 daily cases, using South Korea as our example, and use a deep learning model for time series forecasting.